
Alicia and I spent Election Day on the road across Nashua and ended it at Fody’s Tavern, watching the results come in with some incredible people. In between, we drove to every ward in the city to collect check-in counts, and stopped along the way to talk with people at the polls. Those counts fed the turnout estimates that ran on the site all day.
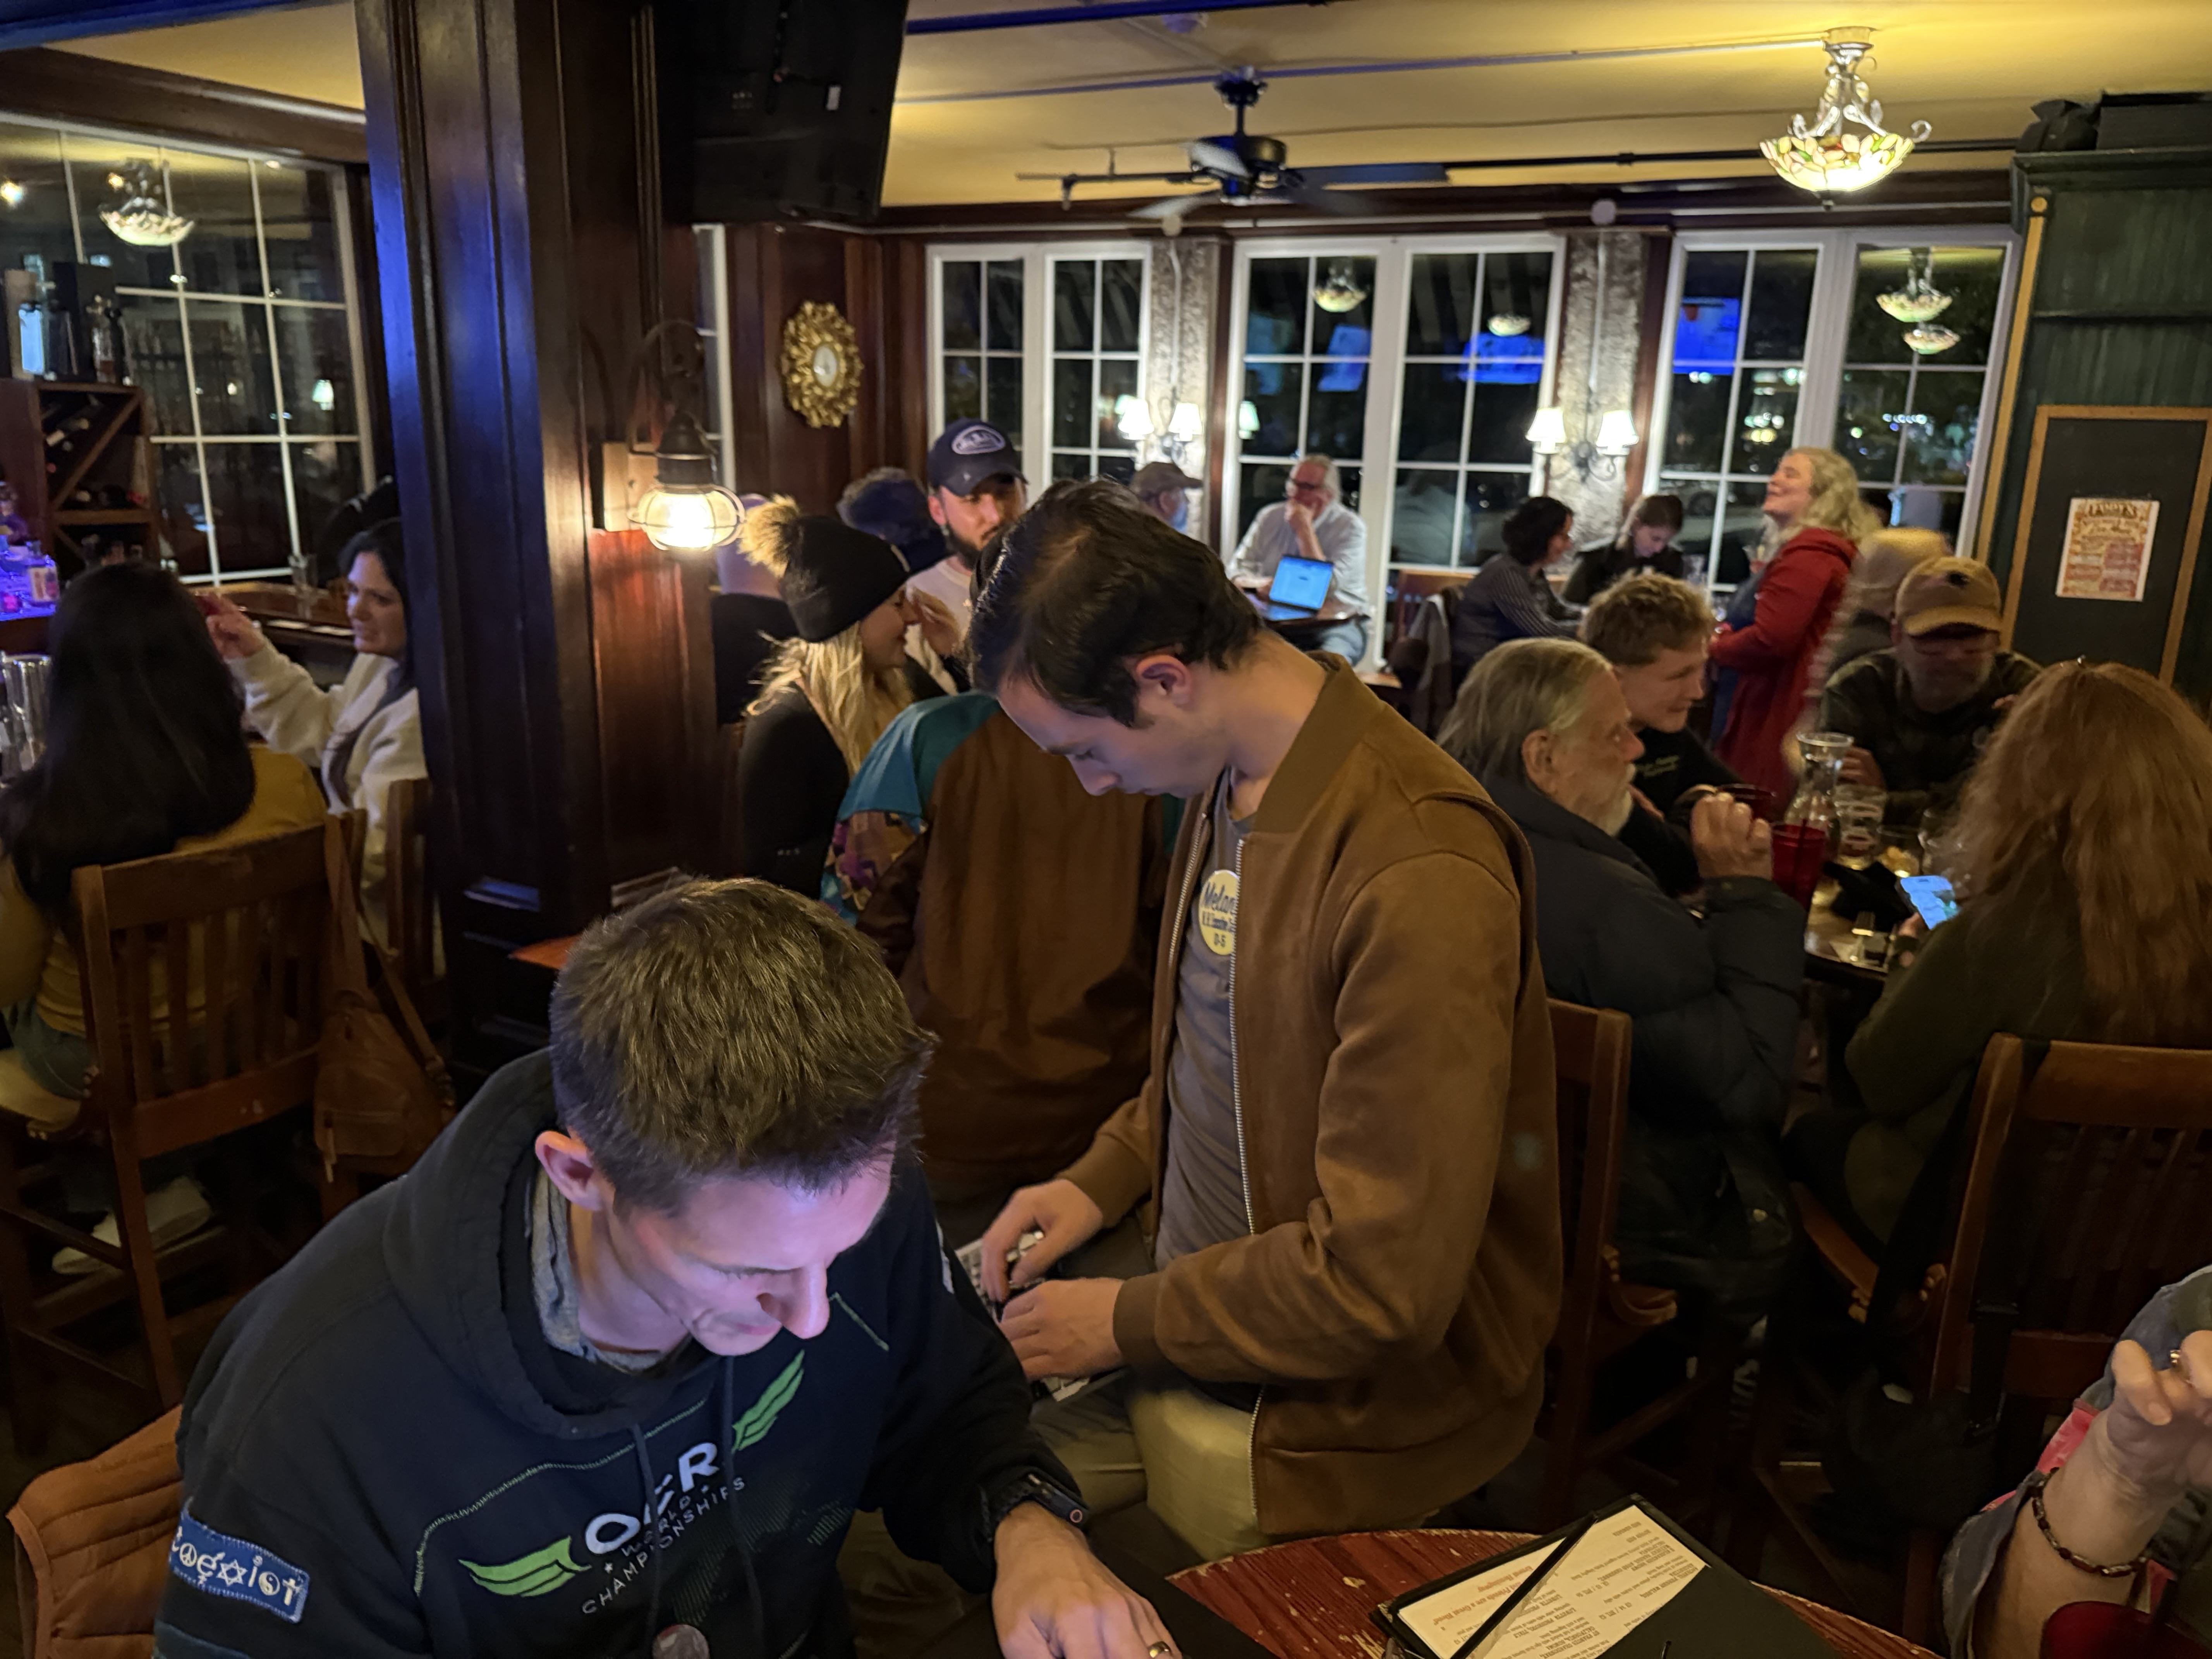
Then the polls closed, and the night got interesting fast. A new twist this year: several wards run two counting machines, and each machine prints its own results tape. My upload tool had been built for one tape per ward, so the second tapes broke it. To everyone who witnessed my face last night, I’ll admit I was stressed (a quick apology to anyone who caught me in that moment). Just as a point: if I was stressed having to pivot, you can imagine what the City Clerk’s Office had to deal with to get the official results out. I was able to patch the software on the spot by adding each ward’s two tapes together into one before uploading, and the results started to flow.
The moment the first ward came in
Ward 4 was the first full result we entered: 2,064 ballots, about 6% of the city’s vote. Within seconds the forecast moved, and it moved a lot.
The model compares each ward with how that ward usually votes. Ward 4 is always Nashua’s most Democratic ward, but this time Democrats were running 4 to 7 points ahead of even that. The model applied that shift across the city, and the Nashua governor’s race flipped from a narrow Ayotte lead to Cinde Warmington. That’s how it ended.
That was the first real sign of the night: the polls had been too cautious about Democrats, and one ward had already shown us by how much.
As the wards rolled in: what the model got right
Wards 9 and 6 came next, then the rest of the city, and with every tape the room got more excited. Each new result mostly confirmed what Ward 4 had suggested.
- One ward was enough to correct most of the polling miss. Before results, the model was off by about 3.6 points in a typical Nashua race. After Ward 4 alone, it was off by less than half a point.
- Turnout. We expected about 33,000 Nashua voters. The final count was 33,400.
- The winners. With all nine wards in, the model had Chris Pappas winning the Senate race, Maggie Goodlander keeping her seat in Congress, and Kelly Ayotte winning re-election as governor. All three happened. Its statewide Senate and Congress estimates came within a fraction of a point of the actual results.
- The State House seats. It gave Democrats about a 76% chance of winning all 27 of Nashua’s seats, and they won all 27. It flagged Ward 9, where Rep. Bill Ohm has a personal following, as the one to watch. Ward 9 was the closest seat in the city, decided by 296 votes.
- The way the wards vote in relation to each other are pretty close from election to election. This is the heart of why one ward could predict how everything would relatively shape up. When Sherry Dutzy won Ward 4 by the margin she did, you could almost predict how the next set of wards would vote. That’s why, as soon as Ward 4 came in, the model changed in her favor. When Ward 9 followed and corroborated the relative voting pattern, you could tell that it was going to be a long night for Dave Fredette.
- The County and State Senate Races could confidently be called early once a ward result came in, but with a catch. It was obvious that once this shift was seen in one ward and corroborated by another that Melanie Levesque and Carryl Roy would win… partially because the shift showed them up by a ton, but also because a shift within a city happens to some degree to an entire state. There is less than a percent probability that a neighboring town will somehow retreat into a deeper vote that will contradict what the adjacent town voted. In real terms: you’ll never see Nashua see a blue shift like this, and somehow Hudson doesn’t see a similar shift of some sort in the same election. That’s not a thing. If it happens across 9 wards in Nashua, some degree of that is likely happening all over the state. And it was corroborated by the 3.7 shift NATIONALLY towards the Democrats across the US.
Where it went wrong, and why
Before any results came in, the model had every Nashua race too close. Democrats beat its forecast in all of them, by about 3.5 points of vote share in a typical race and by as much as 6.5.
| Race (Nashua) | Model before Election Day | Actual result |
|---|---|---|
| Governor | Ayotte by 1 | Warmington by 5.5 |
| U.S. Senate | Pappas by 19 | Pappas by 26 |
| Congress | Goodlander by 29 | Goodlander by 31 |
| County Attorney | Bennett by 10 | Bennett by 20 |
| County Commissioner | Dutzy by 4 | Dutzy by 17 |
- The polls were too Republican, and not just here. The model is built on public polls. The final national polls had Democrats ahead by about 9 points in the race for Congress (RealClearPolling); early estimates have them winning by 13 to 14 (G. Elliott Morris). Even Nate Silver’s forecast, which called the right winners, expected a smaller wave (Silver Bulletin). Turnout wasn’t the problem: about the expected number of people voted, but they leaned more Democratic than the polls expected.
- Some Republicans’ personal following shrank. The model gave a few Republicans extra credit for running ahead of their party in past years, such as County Commissioner candidate David Fredette. In a wave year, more people vote a straight party line, and in Nashua most of that edge disappeared.
- One race sat still. The State Senate District 12 estimate didn’t move after the first three wards, because none of them is in that district, even though every other race had just shifted about 4 points.
What we’ll do differently next time
- A confidence score on every race. Each race will show how sure the model is that the leader wins. At 90% or higher it will make a call; below that, it says “no call.” Scored that way, this year’s pre-election forecast made 7 calls and got 6 right. The one miss was County Commissioner, at 71%, just over the current line.
- Let races without results borrow from races that have them, so no race sits still while everything else moves.
- Shrink personal-vote cushions in a wave. When the first wards show a big swing, credit for candidates who usually outrun their party will shrink.
- Handle polls better. Include more national polls. Rate pollsters by their track record, flag polls paid for by a party, and watch the newest polls for late movement.
- Fix the upload tool for two-machine wards, so each tape can go in on its own and be added up automatically.
- The Ben Clemons Gut Check™️. Once the model detected the shift from Ward 4, it adjusted. But it took results to figure out the shift. Colleague and long time Alderman Ben Clemons had predicted something was different this year. So we are implementing The Ben Clemons Gut Check™️ filter in future models to predict Nashua’s results.
The goal isn’t to predict every margin perfectly; no one did that this year. It’s to get the winners right, be honest about how sure we are, and let the real results correct the picture as fast as possible. Yesterday, that took one ward’s results to see, and two to solidify.
Something new: when Nashua votes, ward by ward
Those check-in counts we collected all day turned out to be valuable on their own. We now have hour-by-hour turnout for every ward from two elections: the 2025 city election and this year’s state election. We can already see that the patterns differ. This year, a bigger share of voters came in early in the morning than the 2025 pattern predicted, and some wards ran behind in the late morning before catching up after work.
That’s practical information for campaigns and volunteers: knowing when each ward is busiest helps decide where and when to send people to hold signs at the polls.
Thank you, Nashua
To everyone who voted, worked the polls, held a sign, or sent us a photo of a results tape: thank you. Alicia and I couldn’t be more excited for everyone across the city and the state, and we can’t wait to do it again.